If you work in the software engineering or information security field, you should be familiar with all sorts of software bugs – the functional and logical ones, those found during the development and internal testing along with those found and reported by a number of complaining users, those that manifest themselves in the form of occassional, minor glitches in your system’s logic and those that can lose your company 440 million US dollars in 30 minutes; not to mention bugs which can enable attackers to remotely execute arbitrary code on your computer without you even realizing it. While the latter type of issues is usually of most interest to security professionals and 0-day brokers (not all developers, though) and thus the primary subject of this blog, this post is about something else – the investigation of a non-security (and hardly functional) bug I originally suspected win32k.sys for, but eventually discovered it was a problem in the NVIDIA graphics card device drivers.
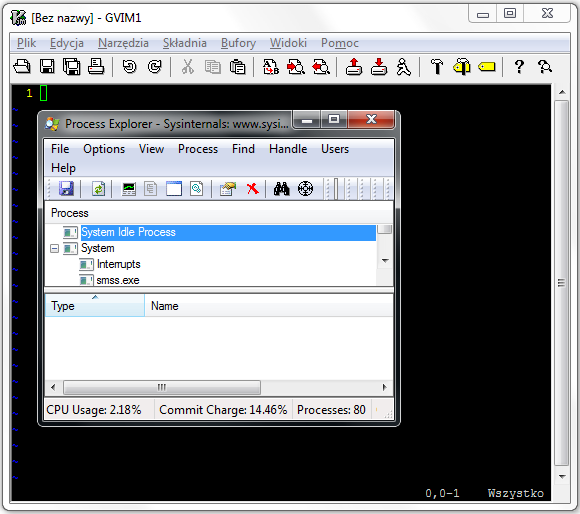
To give you some background, I am a passionate user of vim for Windows (gvim, specifically). When working with code, my usual set up for one of the monitors is a black-themed vim window set for full-screen, sometimes with other smaller windows on top when coding happens to be preempted with some other tasks. The configuration is illustrated in Figure 1 in a slightly smaller scale. A few weeks ago, I noticed that moving the mouse cursor from the vim window over the border of the foreground window (Process Explorer in the example) and inside it, the cursor would be occassionally rendered with colorful artifacts while changing the shape. Interestingly, these artifacts would only show up for a fraction of second and only during one in a hundred (loose estimate) hovers from vim to another window. Due to the fact that the condition was so rare, difficult to reproduce manually and hardly noticeable even when it occured, I simply ignored it at the time, swamped with work more important than some random pixels rendered for a few milliseconds once or twice a day.
Once I eventually found some spare time last week, I decided to thoroughly investigate the issue and find out the root cause of this weird behavior. I was primarily motivated by the fact that colorful artifacts appearing on the display could indicate unintended memory being rendered by the system, with the potential of pixels representing uninitialized kernel memory (thus making it a peculiar type of information disclosure vulnerability). Both Gynvael and I have found similar issues in the handling of image file formats by popular web browsers in the past, so the perspective of disclosing random kernel bytes seemed tempting and not too far off. Furthermore, I knew it was a software problem rather than something specific to one hardware configuration, as I accidentally encountered the bug on three different Windows 7 and 8 machines I use for my daily work.
Following a brief analysis, it turned out I was not able to reproduce the issue using any background window other than vim. While I started considering if this could be a bug in vim itself, I tested several more windows (moving the mouse manually for a minute or two) and finally found that the Notepad worked equally well in the role of a background. Not a vim bug, hurray!
As both windows share the same cursor shape while in edit mode – the I-beam, I concluded the bug must have been specific to switching from this specific shape to some other one. Precisely, while hovering the mouse over two windows and a boundary, the cursor switches from I-beam (![]() ) to a horizontal resize (
) to a horizontal resize (![]() ) and later to a normal arrow (
) and later to a normal arrow (![]() ). Relying on the assumption that the bug is a race condition (or least timing related, as the problem only manifested while performing rapid mouse movements), I wrote the following proof of concept code to reproduce the problem in a more reliable manner (full source code here):
). Relying on the assumption that the bug is a race condition (or least timing related, as the problem only manifested while performing rapid mouse movements), I wrote the following proof of concept code to reproduce the problem in a more reliable manner (full source code here):
LRESULT CALLBACK WndProc(HWND hwnd, UINT msg, WPARAM wparam, LPARAM lparam) {
  CONST UINT kTimerId = 1337;
  CONST UINT kIterations = 100;
  static HCURSOR cursor[3];

  switch(msg) {
    case WM_CREATE:
      // Load cursors.
      cursor[0] = LoadCursor(NULL, IDC_IBEAM);
      cursor[1] = LoadCursor(NULL, IDC_SIZEWE);
      cursor[2] = LoadCursor(NULL, IDC_ARROW);

      // Set up initial timer.
      SetTimer(hwnd, kTimerId, 1, NULL);
      break;

    case WM_TIMER:
      // Rapidly change cursors.
      for (UINT i = 0; i < kIterations; i++) {
        SetCursor(cursor[0]);
        SetCursor(cursor[1]);
        SetCursor(cursor[2]);
      }

      // Re-set timer.
      SetTimer(hwnd, kTimerId, 1, NULL);
      break;
[...]
With the code, I was able to observe the artifacts rendered on my monitor with a high rate per second, which also ensured me the whole thing was not about a problem with my eyes, thankfully. The result of running the test executable on either of my development machines was as shown below:
As the error condition was clearly triggered by one of the SetCursor calls, the function made a great start for an entry point of the actual assembly-level analysis. Sadly, I was not able to reproduce the problem in any of the virtual machines I had in handy, and analyzing obscure parts of the Windows kernel without the ability to attach a remote debugger and poke with the execution flow doesn’t really make much sense. After reviewing the available options for setting up remote kernel debugging for one of my physical machines (see “Setting Up Kernel-Mode Debugging Manually”), I figured that I didn’t have one of the supported ethernet cards, neither had I any of the USB 2.0 / 3.0 debug cables, or two machines with a serial port (which is a pain to use due to limited bandwidth, anyway). The only option left was a 1394 (FireWire) cable, which fortunately didn’t have any special requirements listed by Microsoft. Luckily, I turned out to have two laptops with 4-pin 1394 adaptors and was able to grab one of the last 4-4 pin cables in the nearby Media Markt, completing my debug setup. Somewhat surprisingly, everything worked right away and like a charm – the debugging session was damnably fast and responsive. I highly recommend trying physical remote Windows kernel debugging out, as it is really a whole new experience after spending years on interacting with virtual machines.
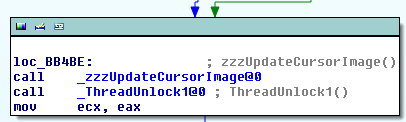
As many of the Windows USER subsystem functions, user32!SetCursor is really only a wrapper to the win32k!NtUserSetCursor system call, so we start off by jumping straight into kernel-mode. If we follow the code execution closely, we end up stepping into the win32k!zzzSetCursor function:
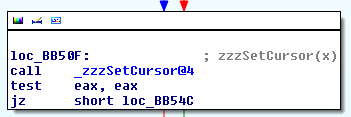
The routine is responsible for updating the global win32k!gpqCursor variable with a pointer to the provided PCURSOR. As the cursor is rendered in a reactive manner (e.g. when its shape or coordinates change), it needs to be re-drawn in case we are its current owners, meaning it is within the boundaries of one of our windows. This is achieved by a call into win32k!zzzUpdateCursorImage, which calls win32k!GreSetPointer, which calls win32k!vSetPointer:
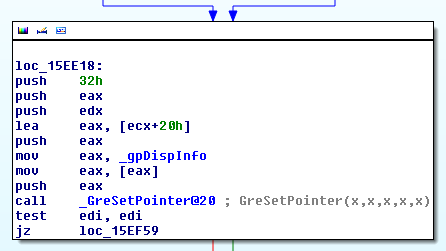
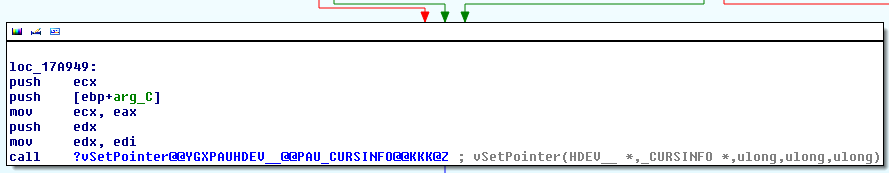
Now, this is where things start to get interesting. If you run the previous proof of concept on the target machine and break in with a remote debugger while the system is in a “bad rendering streak” (e.g. when for each SetCursor call, it renders the wrong shape), you should be able to investigate when the data passed down to each next function becomes inadequate to the actual cursor shape. The win32k!vSetPointer itself function invokes a previously registered DrvSetPointerShape callback:
ULONG DrvSetPointerShape(
  _In_  SURFOBJ *pso,
  _In_  SURFOBJ *psoMask,
  _In_  SURFOBJ *psoColor,
  _In_  XLATEOBJ *pxlo,
  _In_  LONG xHot,
  _In_  LONG yHot,
  _In_  LONG x,
  _In_  LONG y,
  _In_  RECTL *prcl,
  _In_  FLONG fl
);
If we set a breakpoint on the callback invocation, we can examine the callback parameters with special emphasis on psoMask and psoColor, which contain the shape of the cursor:
0: kd> ba e 1 win32k!vSetPointer+0x497

0: kd> g
Breakpoint 3 hit
win32k!vSetPointer+0x497:
80b0116b ff55b8          call    dword ptr [ebp-48h]

0: kd> ln poi(ebp-48)
(99eb0e88)   cdd!DrvSetPointerShape   |  (99eb0ebc)   cdd!bSetHardwarePointerShape
Exact matches:
    cdd!DrvSetPointerShape ()

0: kd> dd esp esp+2c
a1e13ba8  80eb2d98 00000000 a1c66010 00000000
a1e13bb8  00000000 00000000 0000015b 0000010f
a1e13bc8  a1e13c84 00000011 80e6d740 84026348

0: kd> dd poi(esp+8)
a1c66010  00000000 2305076d 00000000 00000000
a1c66020  00000020 00000020 00001000 a1c66174
a1c66030  a1c66174 00000080 00000c3e 00000006
a1c66040  00010000 00000000 00000000 00000000
a1c66050  994db908 00000000 00000000 00000000
a1c66060  00000000 00000000 00000000 00000000
a1c66070  00000000 00000000 00000000 00000000
a1c66080  00000000 00000000 a1c66088 a1c66088

0: kd> .writemem E:\temp\cursor.raw poi(poi(esp+8)+1c) L?1000
Writing 1000 bytes..
The above command log provides us with a number of important information. Firstly, we can see that the callback is handled by the default CDD.DLL file (Canonical Display Driver), so we are still dealing with a Windows component at this stage. Furthermore, we can see that the psoMask parameter is NULL, meaning that “the pointer is transparent”. On the other hand, psoColor points to a valid SURFOBJ structure. The important part is that the cursor has 32×32 dimensions (offsets 0x10 and 0x14 in the memory blob) and is stored in the BMF_32BPP format (offset 0x2c, id=6), thus indicating that the bitmap consumes 0x20 * 0x20 * 4 = 0x1000 bytes. In order to verify that no artifacts are found in the bitmap at this stage, we dump it using the last command. The obtained image is as follows:
![]()
Apparently, no problems thus far. As a side note, when the I-beam pointer is set, the DrvSetPointerShape callback is called with psoMask, but without psoColor set to a valid pointer:
0: kd> dd esp esp+2c
a1e13ba8  80eb2d98 9951db10 00000000 00000000
a1e13bb8  00000008 00000009 0000015b 0000010f
a1e13bc8  a1e13c84 00000001 80e6d740 84026348
Anyway, given that the arrow cursor bitmap is valid at this point (but it still renders incorrectly on the display), we can assume that the bug must be further down the call chain. If you delve into CDD.DLL, you will find out that there are two relevant, nested function calls: from DrvSetPointerShape to SetPointerShapeInternal and then into bSetHardwarePointerShape. The last of these functions clearly does some kind of processing against the bitmap (Hexrays output follows):
  if ( a3 )
  {
    if ( a1 )
    {
      if ( !(*(a2 + 72) & 4) || !bCopyColorPointer(a3, a2, a1, a6, v24, v25, v26) )
        return 0;
      *v9 |= 4u;
    }
    else
    {
      if ( !(*(a2 + 72) & 2) || !bCopyColorPointer(a3, a2, 0, a6, v24, v25, v26) )
        return 0;
      *v9 |= 2u;
    }
  }
  else
  {
    if ( !(*(a2 + 72) & 1) || !bCopyMonoPointer(a2, a1, v24) )
      return 0;
    *v9 |= 1u;
  }
followed by the invocation of another callback:
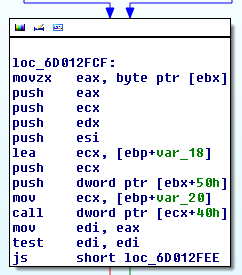
This time, the callback turns out to be dxgkrnl!DxgkCddSetPointerShape, a function residing in the “DirectX Graphics Kernel” module, also part of the default Windows installation. If we load DXGKRNL.SYS with symbols into IDA, it will hint that its third parameter is a pointer to the DXGKARG_SETPOINTERSHAPE structure, which turns out to be well documented by Microsoft. Thanks to the information, we can once again extract the raw bitmap from the parameter and verify that it is correct:
0: kd> ba e 1 cdd!bSetHardwarePointerShape+0x124

0: kd> g
Breakpoint 5 hit
cdd!bSetHardwarePointerShape+0x124:
99eb0fe0 ff5140          call    dword ptr [ecx+40h]

0: kd> ln poi(ecx+40)
(8e2b0ebf)   dxgkrnl!DxgkCddSetPointerShape   |  (8e2b1165)   dxgkrnl!ADAPTER_DISPLAY::DdiSetPointerShape
Exact matches:
    dxgkrnl!DxgkCddSetPointerShape (void)

0: kd> dd esp esp+8
a1e13af8  8401a008 a1e13b2c 80e723e8

0: kd> .writemem E:\temp\cursor.raw poi(poi(esp+8)+14) L?1000
Writing 1000 bytes..
Once again, we end up with the following cursor:
![]()
which would again suggest that the problem resides even deeper down in code interacting with the graphics card. The DxgkCddSetPointerShape routine further passes the execution to ADAPTER_DISPLAY::DdiSetPointerShape which then invokes one, last callback, in my case registered by the NVLDDMKM.SYS module (“NVIDIA Windows Kernel Mode Driver“). The cursor bitmap is still valid (WinDbg output ommited), which strongly indicates that the bug is indeed in the graphics card device driver. For my version of the driver (9.18.13.2018, md5=975026ee6af72cd0954aecddad43f8ef), the rest of the callstack is as follows: nvlddmkm+0x74b9d0 (top-level callback) calls nvlddmkm+0x6dd784, which calls nvlddmkm+0x75a86, which calls nvlddmkm+0x7404c. Finally, the last function contains the following memcpy call, which moves the bitmap data straight into a memory-mapped video buffer:
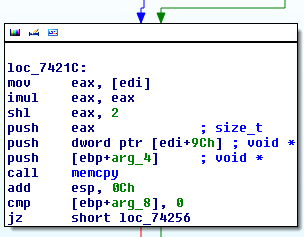
More precisely, the above call is responsible for moving a color-enabled 32-bpp bitmap into one of the frame buffers. There is a similar memory invocation for monochrome bitmaps in the nvlddmkm+0x73cd0 function:
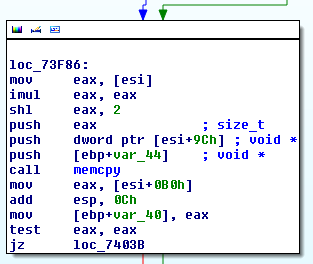
If we set a breakpoint and examine the dst parameter of respective memcpy calls, we will notice that during normal (correct) mode of operation, there are in fact two distinct frame buffers, each 16384 (0x4000) bytes long, used by the driver in an alternating manner:
0: kd> ? poi(esp); g
Evaluate expression: -1817100288 = 93b14000
[...]
0: kd> ? poi(esp); g
Evaluate expression: -1817116672 = 93b10000
[...]
0: kd> ? poi(esp); g
Evaluate expression: -1817100288 = 93b14000
[...]
0: kd> ? poi(esp); g
Evaluate expression: -1817116672 = 93b10000
[...]
0: kd> ? poi(esp); g
Evaluate expression: -1817100288 = 93b14000
[...]
0: kd> ? poi(esp); g
Evaluate expression: -1817116672 = 93b10000
[...]
If you take a closer look at the contents of the src parameter (dump it to file and try to render as a 64×64 bitmap), it becomes visible that the format of the color cursors’ bitmap hasn’t changed much and is still a line-by-line 32-bpp buffer of pixels, only difference being that it has been extended from 32×32 to 64×64 dimensions. However, the same technique doesn’t seem to work with monochrome bitmaps: if we try to render the I-beam cursor representation as a 64×64 32-bitmap, we’ll end up with the following image:

That’s not really how the cursor looks on the screen – more like how it looks in the broken version as a part of the artifacts… something to keep in mind. After playing with different configurations for a while, it turns out that the bitmap renders correctly when interpreted as a 16-bpp image with 128×64 dimensions:

The 16-bit structure of each pixel is as follows: [0][5-bit R][5-bit G][5-bit B], which means that the value of 0x0000 denotes black (transparent) and 0x7fff denotes white, which appears compatible with what we can see in the memory dump corresponding to the first few lines of the bitmap:
93b14000 0000 0000 0000 0000 0000 0000 0000 0000 0000 0000 0000 0000 0000 0000 0000
93b1401e 0000 0000 0000 0000 0000 0000 0000 0000 0000 0000 0000 0000 0000 0000 0000
93b1403c 0000 0000 0000 0000 0000 0000 0000 0000 0000 0000 0000 0000 0000 0000 0000
93b1405a 0000 0000 0000 0000 0000 0000 0000 0000 0000 0000 0000 0000 0000 0000 0000
93b14078 0000 0000 0000 0000 0000 0000 0000 0000 0000 0000 0000 0000 0000 0000 0000
93b14096 0000 0000 0000 0000 0000 0000 0000 0000 0000 0000 0000 0000 0000 0000 0000
93b140b4 0000 0000 0000 0000 0000 0000 0000 0000 0000 0000 0000 0000 0000 0000 0000
93b140d2 0000 0000 0000 0000 0000 0000 0000 0000 0000 0000 0000 0000 0000 0000 0000
93b140f0 0000 0000 0000 0000 0000 0000 0000 0000 0000 0000 0000 0000 0000 0000 0000
93b1410e 0000 0000 0000 0000 0000 0000 0000 0000 0000 0000 0000 0000 0000 0000 0000
93b1412c 0000 0000 0000 0000 0000 0000 0000 0000 0000 0000 0000 0000 0000 0000 0000
93b1414a 0000 0000 0000 0000 0000 0000 0000 0000 0000 0000 0000 0000 0000 0000 0000
93b14168 0000 0000 0000 0000 0000 0000 0000 0000 0000 0000 0000 0000 0000 0000 0000
93b14186 0000 0000 0000 0000 0000 0000 0000 0000 0000 0000 0000 0000 0000 0000 0000
93b141a4 0000 0000 0000 0000 0000 0000 0000 0000 0000 0000 0000 0000 0000 0000 0000
93b141c2 0000 0000 0000 0000 0000 0000 0000 0000 0000 0000 0000 0000 0000 0000 0000
93b141e0 0000 0000 0000 0000 0000 0000 0000 0000 0000 0000 0000 0000 0000 0000 0000
93b141fe 0000 0000 0000 0000 0000 0000 0000 0000 7fff 7fff 7fff 0000 7fff 7fff 7fff
93b1421c 0000 0000 0000 0000 0000 0000 0000 0000 0000 0000 0000 0000 0000 0000 0000
At any point in time, we can describe the currently displayed cursor with the following tuple: (current frame buffer #, frame buffer bitmap, display mode). During normal mode of operation, consecutive cursor shape changes are performed in the following manner:
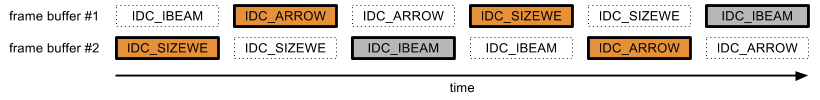
Shapes with a solid line border denote the frame buffer which is currently mapped to display. The colorful shapes rendered in 32-bpp mode are marked with the orange box color, while monochrome bitmaps rendered in 16-bpp mode are gray in the above figure. In the correct mode of execution, the display-mapped frame buffers alternate, thus rendering each cursor in the right time and rendering mode. However, when we start spamming the driver with cursor change requests, it becomes confused as to which frame buffer should be mapped to the screen, thus leading to the following situation (confirmed experimentally, I’m unable to prove this with WinDbg logs, as showing the problem requires access to the target machine’s display):

As shown in Figure 10, the device driver still copies the cursor shape into the correct (alternating) frame buffers, and it still uses the adequate rendering mode during each switch. What goes wrong, however, is that the driver fails to swap the “active” buffers in each iteration, and instead only does it for every second request. The specific reason of this phenomenon has not been established – lacking symbols, documentation or other debugging information for the graphics card driver makes it rather inconvenient to continue the analysis. As the problem only occurs for rapid cursor changes, it is clear that the issue is timing related (possibly a race condition); I suppose it might have to do with the v-sync mechanism, but that’s just a guess. One way or another, the bug causes the graphics card to sometimes render the wrong bitmap using the correct (for the iteration) mode; due to the fact that bitmaps present in the two frame buffers can use different data formats (16-bpp vs 32-bpp), the mismatch can thus lead to artifacts such as those presented in the video at top of the post. Specifically, depending on the rendering offset at which the frame buffer-switching mechanism starts to fail, it is possible to observe the following invalid shapes (on the example of the proof of concept code above):
- The IDC_IBEAM cursor being rendered as a 64×64 32-bpp bitmap:
- The IDC_SIZEWE cursor being rendered as a 128×64 16-bpp bitmap:

- The IDC_ARROW cursor being rendered as a 128×64 16-bpp bitmap:

Looks familiar, right? The rendering mode mismatch also perfectly explains why the bug could only be reproduced using the following chain of cursors: monochrome → any → colorful; otherwise, the driver would still render the wrong shapes at times, but you wouldn’t be able to notice it anyway. That was quite a journey from random mouse blinks over the vim window to the NVIDIA graphics card driver internals. :)
As far as I’m concerned, this issue doesn’t have any security impact, as the cursor frame buffers would never contain data or bitmaps other then the cursor shape itself, which is by no means secret information or something you would like to disclose. Furthermore, even if the buffers were shared to store any kind of interesting data while not mapped to the display, the bug would still require physical access to the machine and a high-quality camera or ability to plug into one of the video sockets to be able to capture the misrendered data. However, a bug in the cursor-changing mechanism might be a good indicator that other video services implemented by the NVIDIA drivers might be suspectible to timing related problems, and possibly more severe ones than one discussed here.
Other device drivers
For completness, I decided to briefly test some other drivers I had in handy. Both the BasicDisplay.sys (version 6.2.9200.16384) driver found in the default installation of Windows 8 32-bit and the latest drivers for the Intel HD Graphics 4000 card are not affected and handle rapid cursor switches correctly. Interestingly though, some AMD drivers seem to suffer from a similar problem (artifacts while rendering rapidly changing cursor), but of a slightly different nature. Thanks to Gynvael for running the test and recording results:
I haven’t investigated the root cause of that one though, so feel free to check it out. I hope you enjoyed the post, feel free to leave comments, and take care!
Cool stuff!
I’ve had an experience of debugging with all of the types of physical media and I have to say that since net debugging support in W8 I’ll never get back to any other type of media! You should definitely switch to net debugging ;)
@Honorary BoT: what makes net debugging so great? :)
These are useful for reclaiming screenspace taken by gui elements:
set guioptions-=m “remove menu bar
set guioptions-=T “remove toolbar
set guioptions+=c “console dialogs
Nice, thanks pakt!
a) The vendor graphics drivers must contain an endless amount of severe security problems. It seems that the exploit community hasn’t really tried to analyze them yet (which is surprising – is it impossible to make money from driver exploits?).
b) Exposing OpenGL via WebGL does not seem like a smart idea. Now you can root the box from a (Chrome-sandboxed) browser frame. And Google does not have the power to fix OpenGL exploits.
I still remember the inflated cursor bug in ATI’s drivers that was covered on Tech Report.
@j00ru: its the speed and better stability! I’ve watched some video on Channel9 about new kernel debugging transports (net and usb3). The guy mentioned that pre8 transports were artificially slowed down. As for USB3 – it is still difficult to find an XHCI with debugging port support.
are you saying that debugging via hardware-cables is faster than going via VMs and VKD?
@tobi: right.
a) I guess they may contain an endless amount of severe security problems, but it’s not certain if this is really the case (and also – how many of them are really reachable from a low-integrity process). There might also be several reasons for lack of public interest in graphics card drivers such as “they’re already widely exploited, but no one has realized yet” or “the market share of each individual driver is too limited to allow for usage in generic attacks” or “they’re more difficult to find and exploit compared to Windows itself” and so forth. There’s been some research done on it anyways, e.g. see Ben Hawkes’ “Browser GFX Security” presentation from Ruxcon 2011.
b) Well yeah, new features are usually added for improved usability/performance and not security. :) Theoretically, you could do that provided a very fortunate vulnerability in OpenGL, but I still think it’s much more realistic to be attacked through the regular use-after-free to execution within sandbox + OS kernel bug combo than with a sophisticated one-shot GL exploit. Let’s see how things unfold, though.
@Yuhong Bao: Are you referring to this one: http://techreport.com/news/17819/radeon-hd-5000-cards-inflate-cursors? I haven’t seen that one before, nice find! :-D
@Honorary BoT: Interesting! I must try it one day then, but honestly, I can’t imagine it being even better than 1394 (which is already 100% responsive and reliable for me thus far). Anyway, thanks for the recommendation :)
@jusme: yep, that’s what I’m saying. Going via VMs is usually implemented via COM ports which makes things slow even if we’re operating within the same physical machine. VKD seems to help (sometimes), but I’ve had multiple issues using it in the past which was quite annoying.
hi,i have some of the mentioned issues with my graphic card exactly the same shapes appears every time and system jammed in every 15-20 sec ,the issues started when i installed the new windows 7 64bit with new Nvidia Driver,the card is 560 ti and since my job is doing heavy graphic related works(3d modeling)this is very painful issue.
any idea how to fix this problem?
@mohammad Modarres: I think you should be best off writing to Nvidia directly. Unfortunately, I am not aware of any workaround for the problem.
I remember seeing the same problem on my computer, most commonly when moving the cursor to/from virtual machines in VMWare Workstation (so I blamed it at first, until I noticed it happening in other windows) – but at least to me, it was immediately obvious that the cursor shape was just rendered at the wrong colour depth (maybe it helped that I use a very distinct pointer arrow shape).
hehe, original PoC software made such a nice ‘demoscene’ effect, so I now take this bug as an awesome feature. Thank’s NVIDIA! ;D
Is there a way to hide the global cursor through WDDM?