The segmentation functionality has been present on the Intel processors since early stages of the CPU manufacturing. In real-mode, segments were the basis of 16-bit memory management, allowing the operating system or application to specify separate memory areas for different types of information, i.e. code, regular data, stack and so on. When a more complex and powerful Protected Mode was introduced in the x86 processors, the usage (meaning) of the six segment registers was completely re-designed. From this point now on, these registers would no longer hold an explicit memory offset (as in real-mode), but instead they would be used to store so-called Segment Selector values, which are in turn pointers into one of the two segment descriptor tables: GDT or LDT (Global / Local Descriptor Table). Because of the introduction of another memory-management mechanism (paging), a great majority of the modern, main-stream operating systems don’t make extensive use of segmentation; they usually initialize GDT with trivial entries (e.g. base=0x00000000, size=0xffffffff), and then completely ignore the existence of segments (except for user ↔ kernel transitions). What is most important, however, is that even though the mechanism is ignored by the OS design, the systems make it possible for an application to set up its own LDT entries (e.g. sys_modify_ldt on Linux, or NtSetLdtEntries on Windows). Consequently, any process can locally make use of segmentation for its own purposes – e.g. in order to implement a somewhat safer execution environment, or other purposes.
More detailed information about segmentation and GDT/LDT management can be found in Intel 64 and IA-32 Architectures Software Developer’s Manual: Volume 3A: System Programming Guide Part 1, and GDT and LDT in Windows kernel vulnerability exploitation by me and Gynvael Coldwind. Any considerations made further in the post are provided with regard to the Windows operating system, which is the main subject of this write-up.
It turns out that the assumption about segment base being 0x00000000 at all times is so strong, that most Windows application developers take it for granted. This approach is usually successful, since most programs do not deal with cpu-level execution flow characteristics. However, a certain group of applications – debuggers – DO deal with such kind of data, e.g. when controlling a thread’s execution flow (performing step / trace operations), handling incoming debug events (breakpoints), monitoring thread stack references and so on. Ideally, these programs should be well aware of the segment’s existence, and not get fooled by making the base=0 assumption. (Un)fortunately, neither the world is ideal, nor the common ring-3 debuggers take custom segments into consideration. The question is – why? Are the debuggers’ developers clueless, or the Windows Debugging API doesn’t provide sufficient amount of information to the debugger? Let’s focus on exception management (most of the execution-related operations are based on exceptions), and find out.
Microsoft provides an event-driven model of process debugging (similar to the Linux signals), which is also applied in the documented Debugging API. In brief, a debugger must first attach to the debugee (i.e. register itself as the process debugger in the system) by either calling DebugActiveProcess, or simply creating a child process with the DEBUG_PROCESS flag. Furthermore, the debugger should resume process execution (it is suspended upon debugger attachment), and wait for a debug event to appear. The most straight-forward debugger template for Windows looks similar the following:
// Spawn a new process (pi = PROCESS_INFORMATION)
ContinueDebugEvent(pi.dwProcessId, pi.dwThreadId, DBG_CONTINUE);

while(1)
{
  DEBUG_EVENT DebugEv;
  WaitForDebugEvent(&DebugEv,INFINITE);

  // Handle the event specified by DebugEv
  ContinueDebugEvent(DebugEv.dwProcessId, DebugEv.dwThreadId, DBG_CONTINUE);
}
The debug event can be one of nine possible types (see the DEBUG_EVENT structure documentation), most important which for us is EXCEPTION_DEBUG_EVENT. The EXCEPTION_DEBUG_EVENT structure plays the role of the event descriptor: it provides the exception type, address, and additional information such as the memory reference type (read/write) and operand, in case of STATUS_ACCESS_VIOLATION. Even though the faulting instruction location is characterized by a CS:EIP pair, the DebugEv.u.Exception.ExceptionRecord struct only informs about the latter value:
- ExceptionAddress
-
The address where the exception occurred.
In general, the MSDN library doesn’t make any explicit distinction between a relative address (i.e. the EIP value), and an linear address – the actual CS:EIP pair translated into an address where the code was executing at. Furthermore, the debugging API specification (and implementation) silently assumes that both of these values would always be equal, thus ExceptionAddress will always contain just the EIP register contents, at the time of the exception generation. Any debugger that makes use of the interface, and believes that the addresses passed to the debugger through numerous structures are always linear, is prone to a bug, making it impossible to dynamically analyze certain executable files.
In order to interpret the incoming exception descriptors properly, a debugger must take the following steps to perform a valid address translation:
- Receive an exception event
- Open the thread, which caused the exception (or obtain the handle in any other way, e.g. look it up in a special table, updated on the CREATE_THREAD_DEBUG_EVENT basis)
- Call GetThreadContext with the CONTEXT_SEGMENTS flag set, in order to obtain the value of CS:
- Call GetThreadSelectorEntry, in order to obtain the descriptor of the custom code selector (i.e. get its base address)
- Calculate the linear address as Segment Base + ExceptionAddress (or any other field, containing a relative address)
Although the above list of steps is quite simple, it is worth to note that MSDN doesn’t give a single clue, that any of the address-oriented fields in the Debug API structures might not store a valid linear address, which can be relied on at all times. To my best knowledge, the two most commonly used ring-3 debuggers (Ollydbg, Immunity Debugger) DO NOT properly interpret the incoming addresses, consequently making it impossible for a RE to debug (i.e. put and catch breakpoints, step-by-step through instruction blocks) chunks of code executing under a custom segment. This phenomenon could be used not only to completely prevent the user from live-debugging certain parts of assembly code, but also fool the reverser in numerous, amusing ways (e.g. map some code at both the linear and logical execution address, making the user think he analyzes a real chunk of code, while it’s actually a fake).
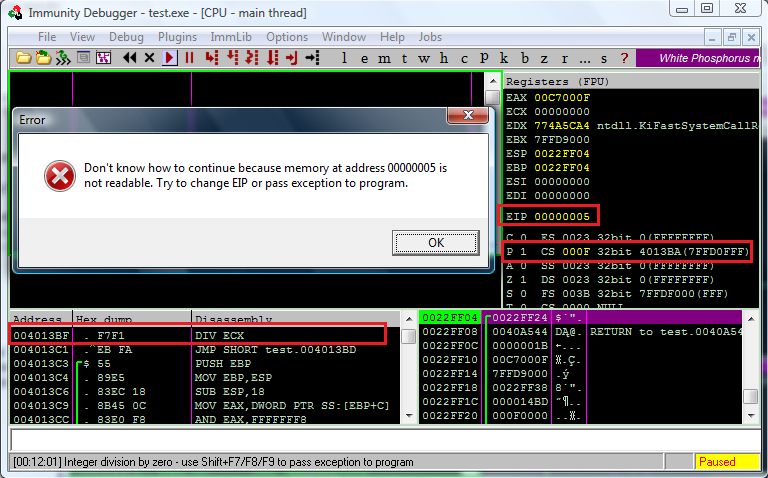
The following screenshot presents the Immunity Debugger having serious problems with an Division By Zero exception, generated within a custom code segment (Ollydbg, based on the same engine, behaves in the very same way):

When it comes to addresses other than the instruction counter – such as invalid memory reference operands (specified in the EXCEPTION_RECORD.ExceptionInformation array), an analogous situation doesn’t exist. This time, however, the documentation directly informs the developer, that the supplied value will be the final, linear address, by using the word virtual:
- EXCEPTION_ACCESS_VIOLATION
The first element of the array contains a read-write flag that indicates the type of operation that caused the access violation. If this value is zero, the thread attempted to read the inaccessible data. If this value is 1, the thread attempted to write to an inaccessible address. If this value is 8, the thread causes a user-mode data execution prevention (DEP) violation.
The second array element specifies the virtual address of the inaccessible data.
Although a matter of terminology, the additional virtual annotation would be most often understood as a linear address, i.e. an address after the segmentation evaluation. As far as implementational details are considered, ExceptionInformation[1] is actually guaranteed to contain the desired value, because the operating system directly loads the contents of the CR2 register there, right after the exception takes place. The second Control Register is, in turn, described by the following quotation:
CR2
Contains a value called Page Fault Linear Address (PFLA). When a page fault occurs, the address the program attempted to access is stored in the CR2 register.
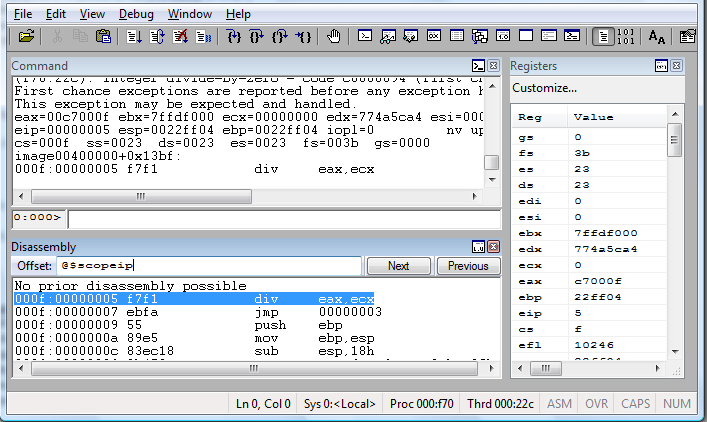
Interestingly, another popular debugger (WinDbg), which can be also used for regular user-mode application debugging, can easily manage code running in the context of any segment (Microsoft seem to be more aware of their own technology that 3-rd party developers, what a surprise :)):

Yeah… that’s more or less it for today. I believe that this technique hasn’t been publicly described, or implemented on a large scale anywhere on the net (in the context of anti-debugging measures, of course), yet. If you would like to work with a Proof of Concept code, there’s nothing easier than that: just take a look at my & Gynvael’s Pimp CrackMe (post: Pimp My CrackMe contents results). This part of the post:
The engine of the CrackMe was actually created as a Proof-of-Concept project, which aims to present, how to take advantage of one, very interesting Intel x86 mechanism
referred to the method explained today. You can just launch your IDA, and see how the code works right away, or you can also wait for Bartek to make the contest submissions’ source code available for a wider audience. Either way, have fun!
BTW. Due to a holiday trip I am setting of tomorrow, the successive Sunday Blog Entry (which would originally appear on 26 June) will be published with a slight delay, earliest on Thursday, 30 June. Take care! :)
Update: As it turned out, Petter Ferrie has already mentioned about the LDT technique in his ANTI-UNPACKER TRICKS – PART ONE paper, in 2008.
The general concept of LDTs was described publicly:
http://pferrie.tripod.com/papers/unpackers21.pdf
section 2.1.2 NtSetLdtEntries
and used by some malware. No exception generation was necessary in that case, since most debuggers couldn’t step into the code anyway. :-)
@Peter Ferrie: Wow, apparently there’s hardly any anti-debugging technique left, that was not described in one of your papers! Thanks for the notice, I’ll add a reference to your document.
The exception generation is indeed an option. In this post, it was used to illustrate the debugger’s inability to recover, after trying to manage custom-segmented code ;)
> and used by some malware.
LDT успешно используется для подмены сегментов, есть такая оуткит технология IDP.
> NtSetLdtEntries
Есчо есть ProcessLdtInformation. Также можно создавать дескрипторы через KiGetTickCount(Int 0x2A), но только если кодовый селектор уже изменён.
> Есчо есть ProcessLdtInformation. Также можно создавать дескрипторы через KiGetTickCount(Int 0x2A), но только если кодовый селектор уже изменён.
Yeah, I believe that the KiGetTickCount trick has became quite popular, especially after taviso tweet: http://twitter.com/#!/taviso/status/21920108007923712 and aionescu’s reply: http://twitter.com/#!/aionescu/status/21938650354810880 :-)