 A few days ago at the REcon conference in Montreal, I gave a talk titled Bochspwn Reloaded: Detecting Kernel Memory Disclosure with x86 Emulation and Taint Tracking. During the presentation, I introduced and thoroughly explained the core concept, inner workings and results of my latest research project: a custom full-system instrumentation based on the Bochs x86 emulator, designed to detect instances of uninitialized kernel memory disclosure to user-mode applications. This work was largely based on the original Bochspwn research, conducted by Gynvael and me in 2013, whose goal was to identify so-called double fetch conditions in the kernels of various popular operating systems (see SyScan slides and whitepaper, Black Hat slides and source code on GitHub). Bochspwn Reloaded repeated the success of its predecessor, so far having found nearly 30 infoleak vulnerabilities in Windows, and more than a dozen lesser issues in Linux.
The most relevant part of the abstract is as follows:
This presentation will introduce another subtle class of kernel vulnerabilities – disclosure of uninitialized stack and heap memory to user-mode applications. Since information leaks of this kind leave hardly any footprint, they are rarely noticed and reported to system vendors. However, we have found that it is still a prevalent problem in current kernels (especially Windows), and can be abused to defeat certain exploit mitigations or steal sensitive data residing in ring-0. In order to address this matter, we have developed a new Bochspwn-style instrumentation based on rudimentary kernel memory taint tracking, which we then used to discover 30 memory disclosure issues in Windows alone. In this talk, we will discuss the kernel design problems behind the bugs, the design of our tool, and the exploitation process of some of the most interesting findings.
Without further ado, the full slide deck presented at REcon can be downloaded below:
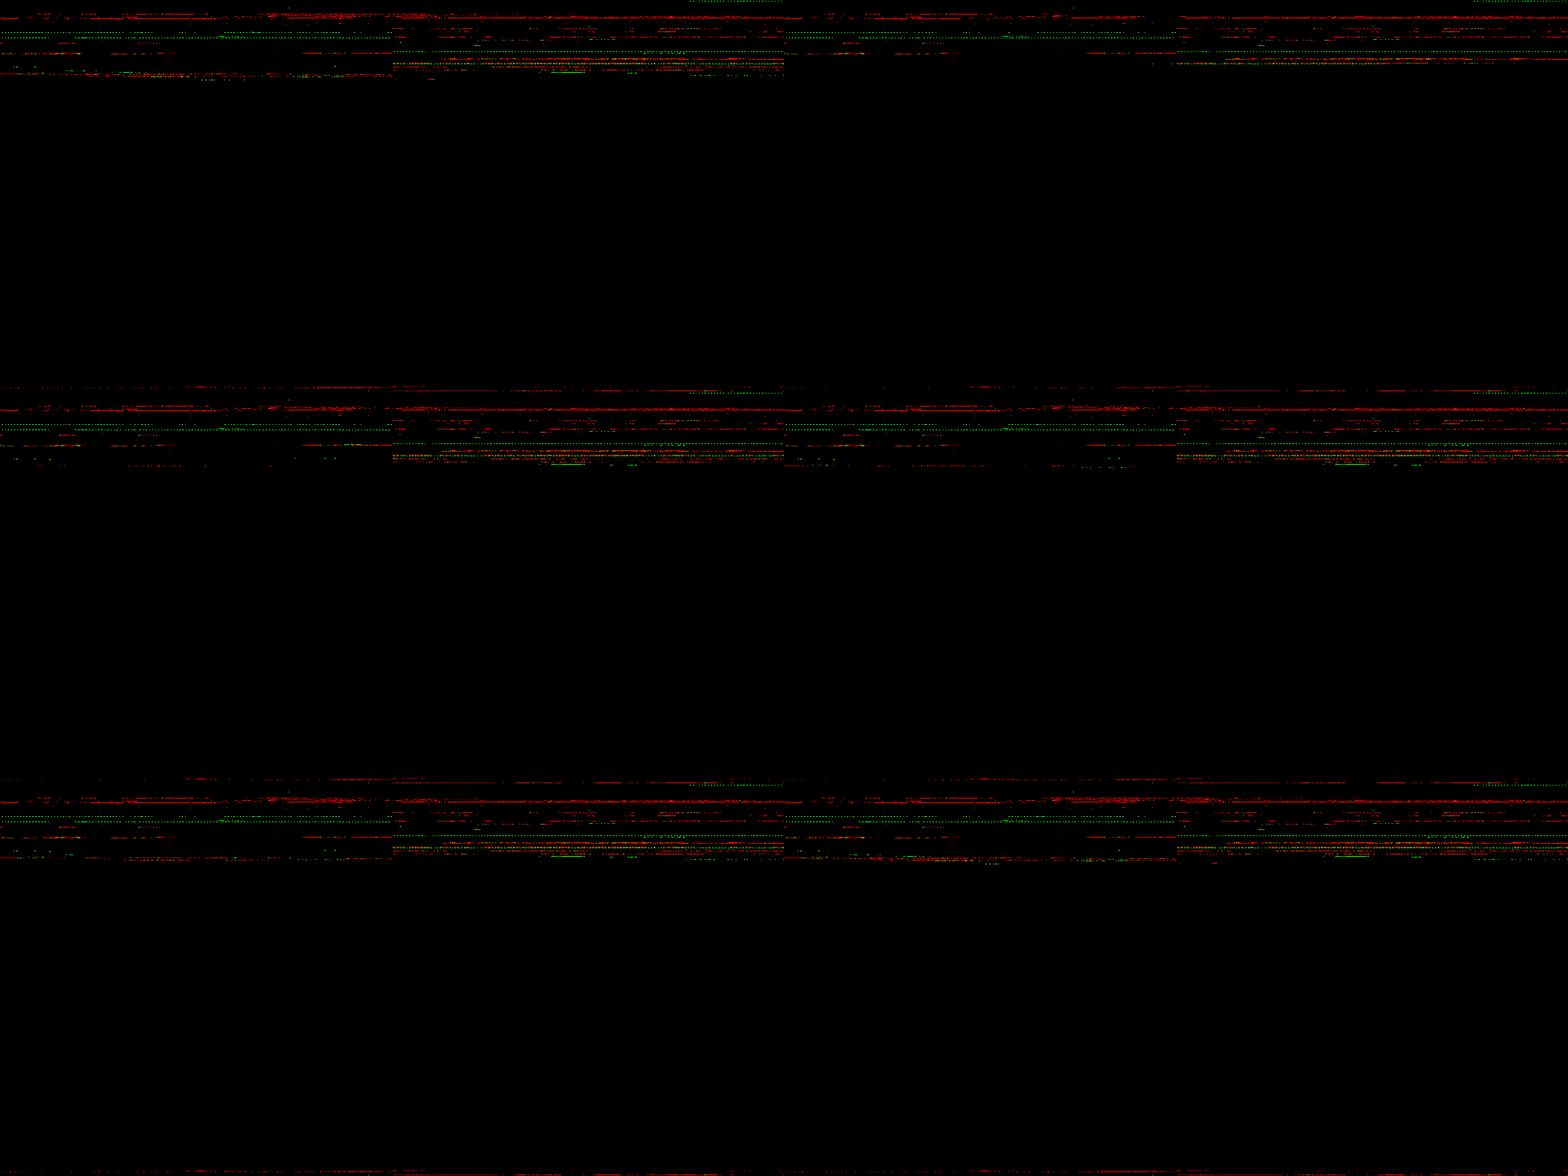
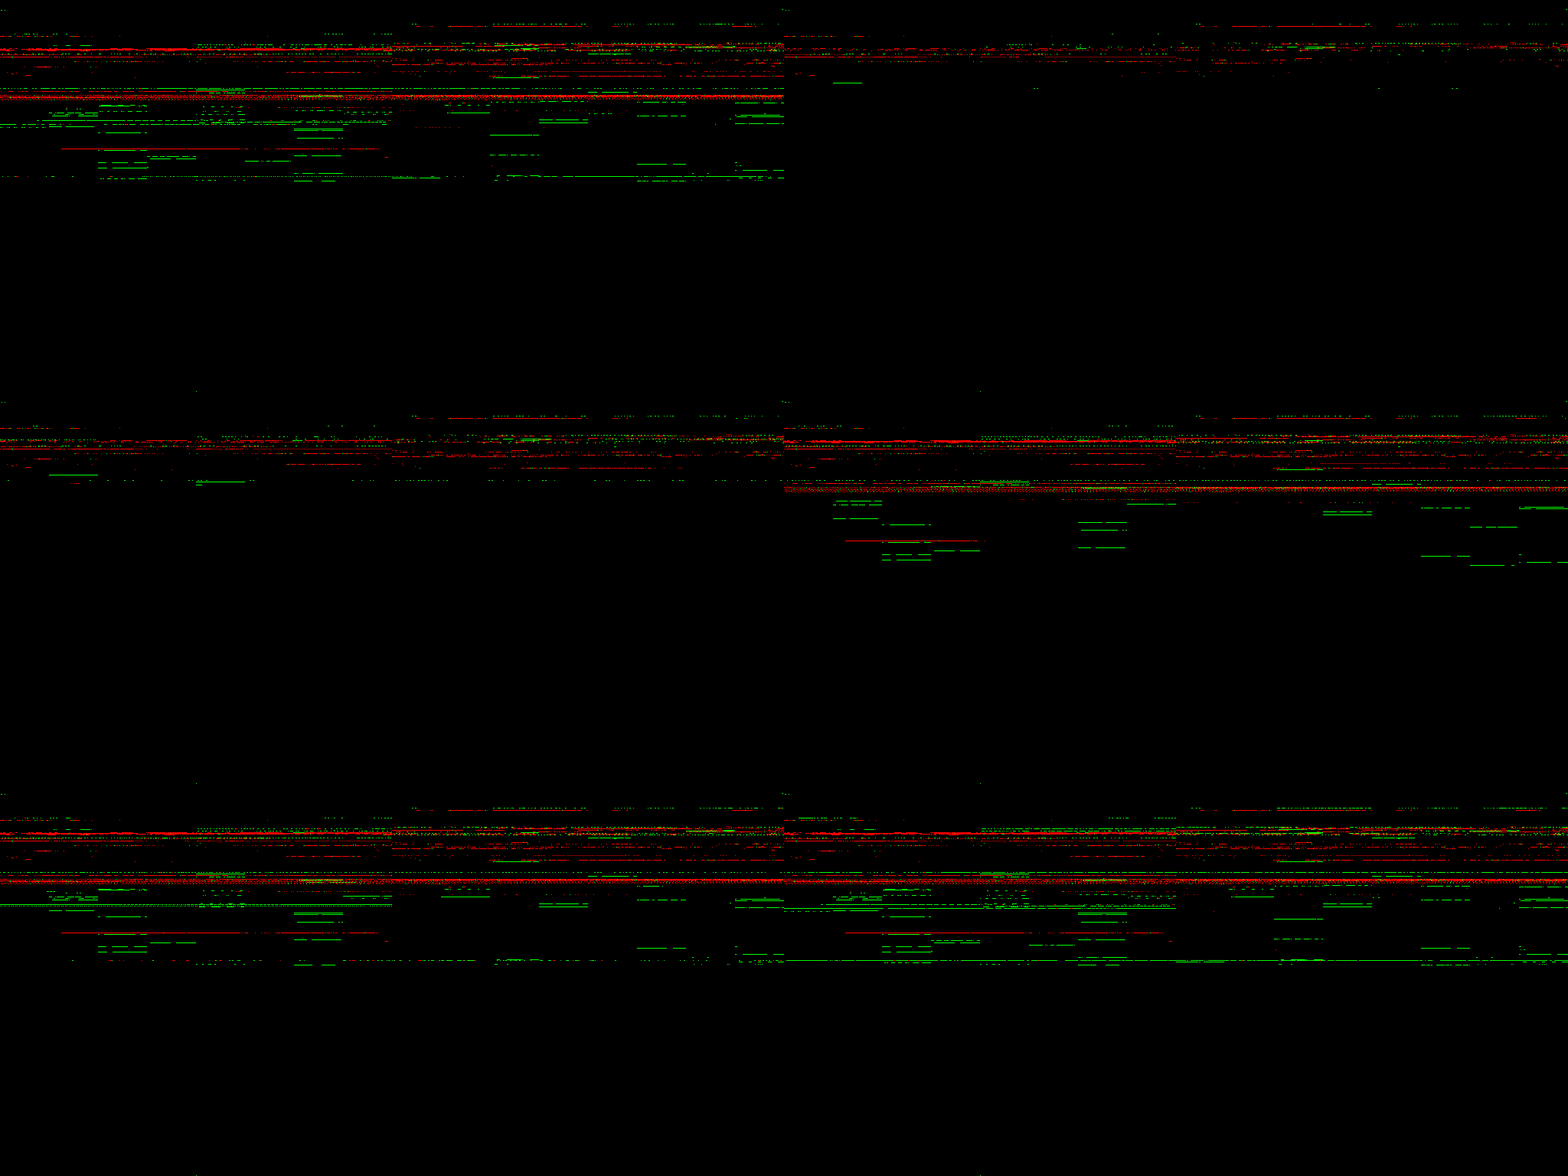
During the presentation, I also showed animated visualizations of tainted memory layouts of Windows 7, Windows 10 and Ubuntu 16.04 (slides 67, 68 and 117). Since they ended up exported as static images in the PDF, I’m including the original GIFs below. These are 1024×512 (or 1024×256 in case of Linux) views of the entire kernel address space, with lower addresses at the top and higher ones at the bottom. Each pixel represents one 4 kB memory page, and is colored green for stack taint, or red for heap/pool taint. Other characteristics such as the total visualized run time, intervals between subsequent frames (memory state snapshots), and actions performed on the systems are listed next to each specific animation. Enjoy!


Is their any disadvantages to what Bochspwn has to offer? What the weakness of Bochspwn? and Is their any ways to extend the tool are any other Analysis techniques that can be implemented?
There are indeed several disadvantages / weaknesses of Bochspwn — poor performance, inability to test drivers for physical hardware, being limited to the scope of the kernel code coverage achieved during testing etc. See slide 99 in https://j00ru.vexillium.org/slides/2018/infiltrate.pdf, and Section 7 “Future work” in https://j00ru.vexillium.org/papers/2018/bochspwn_reloaded.pdf for more details.
As for the second question, there are a number of ways to run other analysis techniques in a similar fashion. I described most of the ones that came to my mind in Appendix A “Other system instrumentation schemes” in https://j00ru.vexillium.org/papers/2018/bochspwn_reloaded.pdf.
I hope that helps,
j00ru