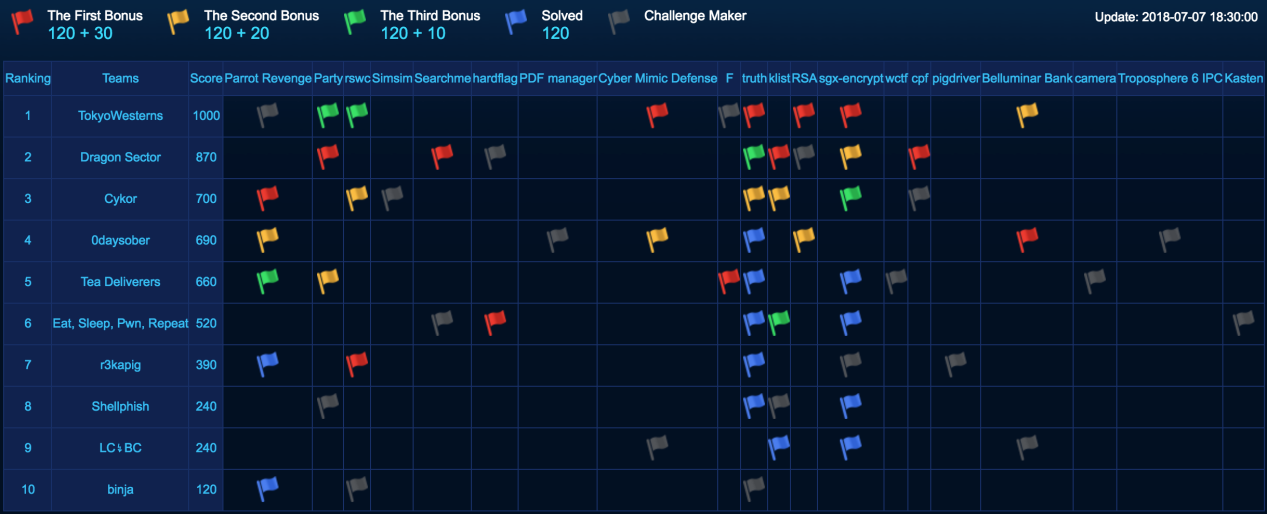
![]() During the weekend of 6-8th of July, our CTF team – Dragon Sector – played in an invite-only competition called WCTF, held in Beijing. The other participants were top-tier groups from around the world (e.g. Shellphish, ESPR, LC↯BC or Tokyo Westerns), and the prize pool of the contest was a stunning $100,000 USD. One particularly unique rule of the CTF was that the challenges were prepared by the teams themselves and not the organizers. Each of the 10 teams was obligated to provide two tasks, at least one of which had to run on Windows. This meant that each team could capture a maximum of 18 flags set up by the other teams in the room. In practice, the structure of the contest incentivized submitting extremely difficult and complex challenges. Remote help was allowed, and the scoring system offered first blood bonus points for being the first, second and third team to solve a task. The hacking part of the event was followed by a soft part, where additional points were granted by a jury and the participants for presenting one’s own tasks on stage.
During the weekend of 6-8th of July, our CTF team – Dragon Sector – played in an invite-only competition called WCTF, held in Beijing. The other participants were top-tier groups from around the world (e.g. Shellphish, ESPR, LC↯BC or Tokyo Westerns), and the prize pool of the contest was a stunning $100,000 USD. One particularly unique rule of the CTF was that the challenges were prepared by the teams themselves and not the organizers. Each of the 10 teams was obligated to provide two tasks, at least one of which had to run on Windows. This meant that each team could capture a maximum of 18 flags set up by the other teams in the room. In practice, the structure of the contest incentivized submitting extremely difficult and complex challenges. Remote help was allowed, and the scoring system offered first blood bonus points for being the first, second and third team to solve a task. The hacking part of the event was followed by a soft part, where additional points were granted by a jury and the participants for presenting one’s own tasks on stage.
After two days of though competition, we came out as the runner up of the CTF with 6/18 tasks solved, behind the winner – Tokyo Westerns (7/18 tasks):
 Following the
  A few days ago at the
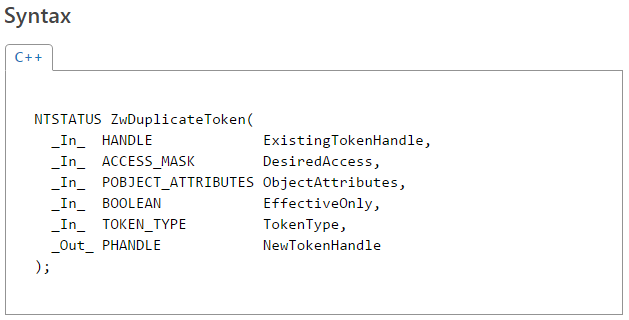

 During the past few weeks, I travelled around the world to give talks at several great security conferences, such as
  The second talk (presented at BH) focused purely on fuzzing and the various thoughts, techniques and results I arrived at after actively using this approach to uncover software security flaws for more than 5 years, both as part of and outside of work. The topics included gathering initial corpora of input files, extracting code coverage information from running programs, using this information to “distill” and manage live corpora (using a parallelized algorithm), interacting with our target application on various levels, and effectively mutating the input data to accomplish the best results. The presentation was then concluded with a brief analysis of my recent Windows kernel font fuzzing initiative, which has resulted in the discovery of
 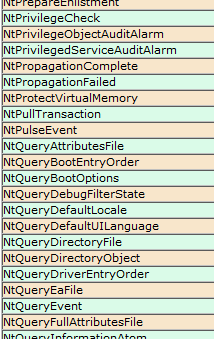 Those of you interested in the Windows kernel-mode internals are probably familiar with the syscall tables I maintain on my blog: the 32-bit and 64-bit listings of Windows system calls with their respective IDs in all major versions of the OS, available here (and are also linked to in the menu):